PROVIDENCE – The Providence-New Bedford-Fall River metro area ranked 148th on the 2013 Milken Institute Best-Performing Cities Index, which evaluated local job growth, wages and salaries growth, and high-tech industry performance in 200 metro areas nationwide to assess the overall economic performance of the nation’s cities.
Providence-New Bedford-Fall River fell 18 spots in 2013 from its previous rank at No. 130 on the 2012 index.
The 2013 best-performing metro area was Austin, Texas, followed by Provo, Utah (No. 2), San Francisco (No. 3), San Jose, Calif. (No. 4), and Salt Lake City (No. 5).
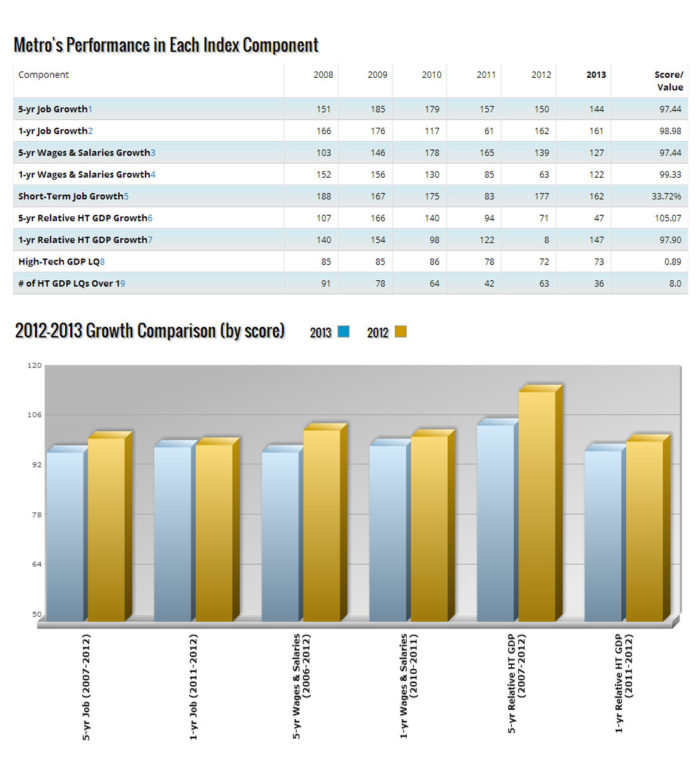
The index comprises nine individual components, each of which received an individual ranking in comparison to the other U.S. metro areas. The respective rankings of Providence-New Bedford-Fall River’s index components in the 2012 and 2013 Best-Performing Cities Indexes were:
- Five-year job growth: 150 (2012), 144 (2013)
- One-year job growth: 162 (2012), 161 (2013)
- Five-year wages/salaries growth: 139 (2012), 127 (2013)
- One-year wages/salaries growth: 63 (2012), 122 (2013)
- Five-year high-tech GDP growth: 71 (2012), 47 (2013)
- One-year high-tech GDP growth: 8 (2012), 147 (2013)
- Short-term job-growth rate: 177 (2012), 162 (2013)
- High-tech GDP concentration: 72 (2012), 73 (2013)
- Number of high-tech industries with GDP concentration above U.S. average:
63 (2012), 36 (2013)
These rankings indicate that despite a marked improvement in five-year high-tech GDP growth, dramatic drops in one-year wage and salary growth and one-year high-tech GDP growth hurt the metro area’s overall ranking.
Six of the nine index components were valued relative to a score of 100 representing the U.S. average. Providence-New Bedford-Fall River fell just shy of the U.S. average in five of those six components, including five-year job growth (97.44/100), one-year job growth (98.98/100), five-year wages and salaries growth (97.44/100), one-year wages and salaries growth (99.33/100) and one-year high-tech GDP growth (97.9/100).
The metro area exceeded the U.S. average in terms of five-year high-tech GDP growth (105.07/100).
The Providence-New Bedford-Fall River metro area reported a 33.7 percent short-term job-growth rate between July 2012 and July 2013. For comparison, the highest job-growth rate reported in the Best-Performing Cities Index was 616 percent, reported in Santa Cruz-Watsonville, Calif. Peoria, Ill., ranked last with a job-loss rate of 220 percent.
In terms of high-tech GDP concentration, the Providence-New Bedford-Fall River metro area scored 0.89 relative to a value of 1 representing the U.S. average, meaning the area’s high-tech GDP is slightly less concentrated than that of the U.S. as a whole. However, eight high-tech industries in the metro area reported a GDP concentration above the U.S. average, well above the five or six industries reported on average among the 200 metro areas surveyed for the Best-Performing Cities Index.
The Milken Institute is a nonprofit economic think tank based in Santa Monica, Calif.


