

PROVIDENCE – Rhode Island ranked No. 38 in the nation for overall fiscal condition, according to a report based on data from fiscal year 2015 released by the George Mason University Mercatus Center on Tuesday.
Last year, in a study on fiscal year 2014, Rhode Island ranked No. 37 in the nation.
The report examined five factors including cash solvency, budget solvency, long-run solvency, service-level solvency and trust fund solvency based on states’ 2015 comprehensive annual financial reports and state actuarial reports.
Rhode Island was ranked No. 4 in New England (No. 38 overall) behind New Hampshire (No. 25), Maine (No. 35) and Connecticut (No. 37). Vermont ranked No. 40, while Massachusetts ranked last in New England and No. 48 in the country.
Rhode Island fiscal 2015 rankings:
- Cash solvency: No. 42 in nation (A measure of whether a state has enough cash to cover its short-term bills.) In fiscal year 2014, Rhode Island ranked No. 41.
- Budget solvency: No. 8 in nation (A measure of whether a state can cover its fiscal year spending using current revenues.) In fiscal 2014, Rhode Island ranked No. 22.
- Long-run solvency: No. 43 in nation (A measure of whether a state has a hedge against long-term liabilities.) In last year’s study on fiscal 2014, Rhode Island ranked No. 39 in the country.
- Service-level solvency: No. 39 in nation (A measure of how high taxes, revenue and spending are when compared to state personal income tax.) In fiscal year 2014, Rhode Island ranked No. 34 in the nation.
- Trust fund solvency: No. 28 in nation (A measure of how much debt a state has.) In fusal 2014, Rhode island ranked No. 29.
Rhode Island fiscal 2015 details:
- The report estimated that Rhode Island had between 78 percent and 187 percent of the cash needed to cover short-term debt, which the report notes is below average among states in 2015. The ratio of cash to short-term liabilities declined from 2014 by 3 percentage points.
- In 2015, revenues exceeded expenses by 6 percent.
- Long-term liabilities in Rhode Island worsened from 2014, to 89 percent of total assets, about $5,377 per capita.
- Government debt was $2.63 billion, the equivalent of 5 percent of state personal income.
- Unfunded pension obligations, on a guaranteed-to-be-paid basis, totaled $17.67 billion, or 33 percent of state personal income.
- Other post-employment benefits total 1 percent of state personal income.
- The report pointed to Rhode Island’s negative net asset ratio for long-term liabilities, which indicates use of debt financing and unfunded pension obligations.
Massachusetts ranked No. 48 on the list up from No. 49 for fiscal 2014. The Bay State experienced an 86 percentage-point uptick in long-term liabilities to total assets from fiscal 2014 to fiscal year 2015. Long-term liabilities in Massachusetts were at $9,919 per capita in 2015.
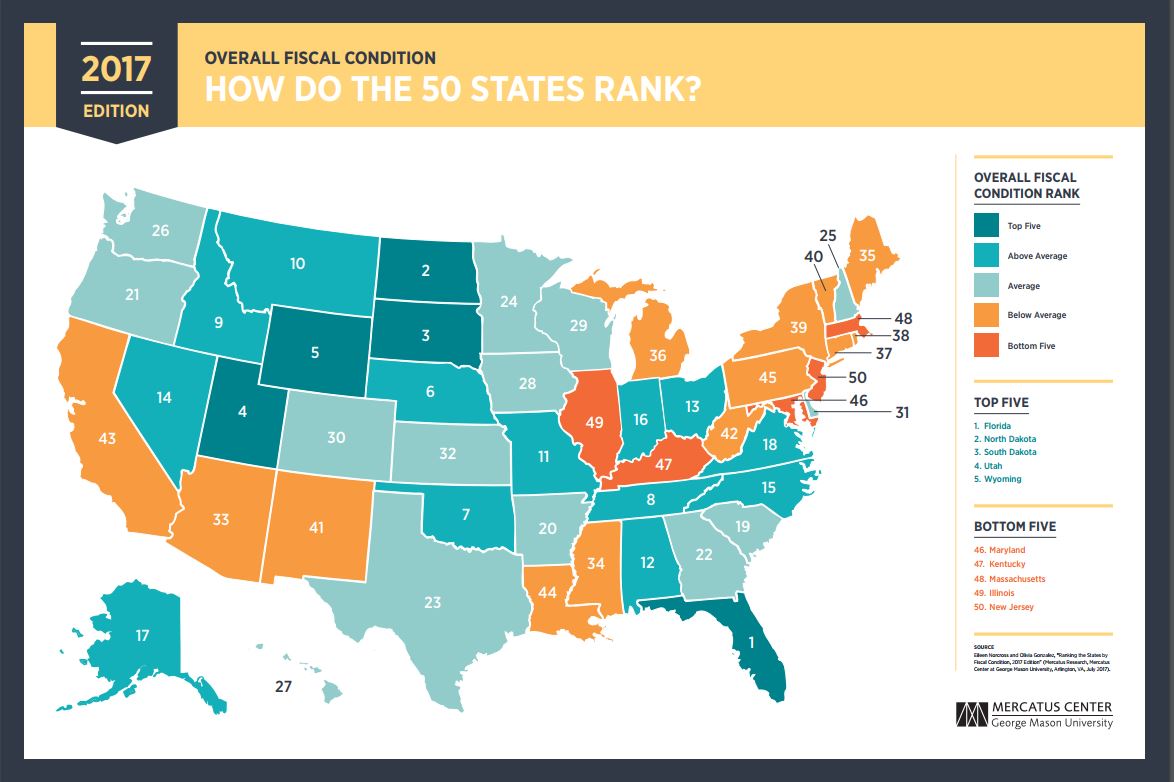
Massachusetts fiscal 2015 ratings:
- Cash solvency: No. 49 in nation, up from No. 50 the year prior.
- Budget solvency: No. 48 in nation, the same as fiscal 2014.
- Long-run solvency: No. 48 in nation, the same as fiscal 2014.
- Service-level solvency: No. 34 in nation, down from No. 31 in the nation in fiscal 2014.
- Trust fund solvency: No. 19 in nation, up from No. 20 for fiscal year 2014.
Chris Bergenheim is the PBN web editor.