
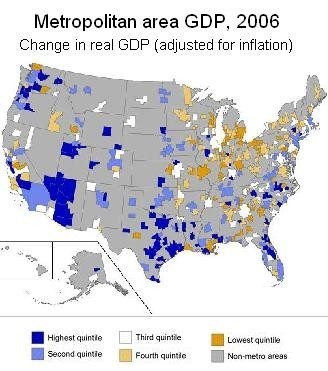
WASHINGTON – The gross domestic product of the nation’s major metropolitan areas grew a seasonally adjusted 3.2 percent in 2006, accelerating slightly from the previous year’s revised 3.1-percent pace, the U.S. Commerce Department’s Bureau of Economic Analysis said today in its second annual metro GDP report.
The growth was widespread, with real GDP (gross domestic product adjusted for inflation) increasing compared with the year before in 308 of 363 metro areas, the BEA found. The strongest growth was in the Southwest and Far West, while the weakest was in the Great Lakes region.
“The real estate industry was the driving force behind growth in many metropolitan areas in 2006,” the BEA wrote. “In metropolitan areas where growth accelerated, however, contributions from the banking industry were more important to economic growth.”
Overall, the financial services industries – real estate and securities, commodity contracts and investments – accounted for 39 percent of metro-GDP growth, the bureau found.
Those increases were partly offset, however, by construction-industry declines. And, while real estate was the biggest contributor to the 2006 GDP in 53 metro areas – none of them in New England – “only 16 … experienced accelerated growth rates,” the BEA said.
ISO 9001:2026: A Practical Opportunity to Build for What’s Next
For Rhode Island manufacturers, ISO 9001 has been much more than a certificate on the…
Learn More
Current-dollar GDP for all 363 major metro areas amounted to $11.8 trillion, or 90 percent of the nation’s $13.1 trillion GDP for 2006, the bureau found. The five largest metropolises – including New York, which with a GDP of $1.1 trillion was second only to the state of California – accounted for 23 percent of the total U.S. GDP, while the smallest 75 metro areas accounted for less than 2 percent.
Before adjustment for inflation, the was 42nd nationwide with a 2006 metro-area GDP of $62.546 billion, or 6.23 percent more than the previous year’s revised $58.878 billion.
The Providence-New Bedford-Fall River region ranked 42nd in metro-area GDP in 2006, with a GDP of $62.546 billion.
In real-GDP growth, the Providence area was 142nd, with an inflation-adjusted gross domestic product that increased 2.76 percent year-over-year to $54.651 billion from 2005’s revised $53.185 billion.
Financial activities contributed 1.23 percentage points to the region’s real-GDP gain; professional and business services contributed 0.53 percentage points; information industry, 0.30; education and health services, 0.22; transportation and utilities, 0.19; leisure and hospitality, 0.02; and government, 0.01 percentage points.
Those gains were partly offset by declines in construction, which pared 0.45 percentage points from metro Providence’s GDP growth; and the natural resources-mining and other services sectors, each of which pared 0.05 points from the region’s total.
Across New England, the average metro-area real-GDP growth was 2.8 percent. “The region’s strongest growth was concentrated in the southern portion where the finance and insurance industries are concentrated,” the BEA said.
Growth was seen in all but two metro areas, led by Connecticut’s Bridgeport-Stamford-Norwalk area, with growth of 4.9 percent. The Boston-Cambridge-Quincy area – the largest metropolitan area in New England, and ninth-largest nationwide – had real GDP growth of 3.7 percent. Losing ground were the Bay State metro areas of Barnstable (-1.0 percent) and Pittsfield (-0.8 percent).
Meanwhile, the per-capita real GDP for all metropolitan areas in the nation in 2006 was $41,510. New England values ranged from $26,176 per person in Springfield, Mass., to $78,944 in the Bridgeport-Stamford-Norwalk area.
Additional information from the U.S. Commerce Department’s Bureau of Economic Analysis, including the full “GDP by Metropolitan Area, 2006 and revised 2004-2005,” is available at www.bea.gov.