
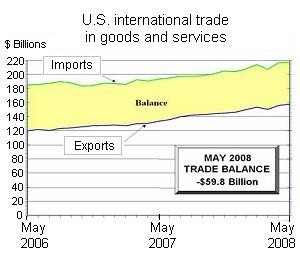
WASHINGTON – The nation’s trade deficit shrank 1.2 percent in May to $59.8 billion, or $700 million below April’s revised $60.5 billion, the U.S. Commerce Department’s Census Bureau and Bureau of Economic Analysis said in a report today.
The decline, which defied both analyst expectations and record oil prices, followed an April increase of 7.1 percent that was smaller than previously thought.
Analysts had anticipated the deficit would widen to $62.5 billion – from the initial April estimate of $60.9 billion – based on the median estimate from a Bloomberg News survey of 74 economists. (Their estimates of the May trade deficit ranged from $59.5 billion to $65 billion.)
U.S. exports of goods and services rose 0.9 percent to a May total of $157.5 billion, or $1.4 billion more than in April. Goods exports increased $0.8 billion to $110.8 billion, as increases in exports of industrial supplies and materials were partly offset by declines in capital goods and in foods, feeds and beverages, the Commerce Department said. Meanwhile, services exports rose $0.6 billion to $46.7 billion, led by increases in travel; other transportation, including freight and port services; and other private services, including business, professional, technical, financial and insurance services; and royalties and license fees.
U.S. imports of goods and services rose to $217.3 billion, or $0.7 billion above their April level. Goods imports edged up $0.3 billion to $183.3 billion, as higher imports of consumer goods and capital goods were partly offset by declines in autos and auto parts; and industrial supplies and materials. Oil imports alone reached a record $31.2 billion, before seasonal adjustment, as higher prices more than offset declining demand, the Commerce report shows. Meanwhile, service imports increased $0.4 billion to $34.0 billion, led by other transportation; other private services; and travel.
The nation’s trade gap with China widened to $21.0 billion from April’s $20.2 billion, although it continued to lag October’s record $25.0 billion. And, among other major trade partners, the U.S. deficit with the OPEC nations surged to $17.9 billion in May from $15.6 billion the month before.
But the United States’ deficit with No. 1 trade partner Canada narrowed to $5.4 billion from April’s $7.4 billion. Also shrinking were the trade gaps with the European Union ($7.9 billion), Mexico ($6.6 billion) and Japan ($5.0 billion), among others.
And the Commerce Department report showed May surpluses with Hong Kong ($1.0 billion), Singapore ($0.2 billion), Australia ($0.8 billion), Belgium ($0.8 billion) and Egypt ($0.3 billion), among others.
“We’re continuing to see that [rise] in foreign demand,” in part because of the weakened dollar, Mike Feroli, an economist at JPMorgan Chase & Co. in New York, told Bloomberg News. “It looks like we’ll get yet another quarter where foreign trade will contribute around a percentage point” to growth in the national gross domestic product, he added.
Compared with May 2007, the nation’s trade deficit grew by $0.4 billion. Total exports in goods and services surged $23.9 billion or 17.8 percent compared with a year ago, while imports rose $24.2 billion or 12.5 percent, the Commerce Department said.
Cybersecurity Awareness Month: What to Do When Your Identity Is Stolen
In recognition of Cybersecurity Awareness Month, it is important to remember that identity theft affects…
Learn More
The U.S. Import Price Index rose 2.6 percent last month, the same as in May, the U.S. Department of Labor’s Bureau of Labor Statistics said in a separate report today. The June rise was led by petroleum prices, which continued to set new records.
The price index for exports rose 1.0 percent in June after rising 0.4 percent in May, the BLS said.
Additional information, including the 47-page U.S. International Trade in Goods and Services report, is available from the U.S. Commerce Department’s Census Bureau and Bureau of Economic Analysis at www.bea.gov.
The June 2008 U.S. Import and Export Price Indexes released today by the U.S. Department of Labor are available online at www.bls.gov/mxp .