Rhode Island’s state and local governments outspent the national average in fiscal 2006, the latest year for which such data are available, according to an analysis released last week by the Rhode Island Public Expenditure Council.
The report, “How Rhode Island’s State and Local Expenditures Compare – 2008 Edition,” relies on data from multiple sources, including government finance reports by the U.S. Department of Commerce’s Bureau of the Census and personal income reports from the department’s Bureau of Economic Analysis. (This report is not directly comparable with past RIPEC reports, due to changes in the calculation of personal income.)
In both FY 2006 and FY 1996, the policy group found, Rhode Island’s direct general expenditures through state and local government “were higher than the national average, both on a per-capita [basis] and per $1,000 of personal income,” RIPEC said in a statement.
Rhode Island’s expenditures of $211.11 per $1,000 of personal income in FY 2006 were 5.8 percent above that year’s U.S. average of $199.56 and 21st highest nationwide.
On a per-capita basis, Rhode Island’s expenditures were $7,725 per person, or 8.8 percent above the national average of $7,101 per capita, putting the state at No. 10.
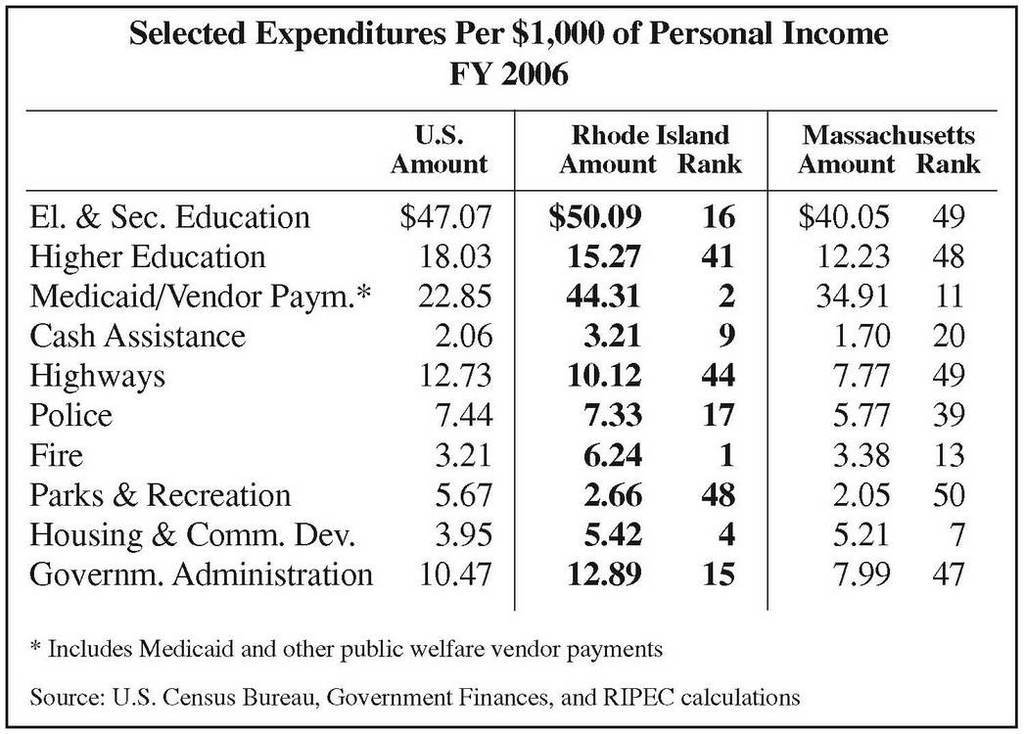
As in years past, “the Ocean State spent more by either measure for public welfare programs, elementary and secondary education and public safety than most other states,” RIPEC said.
The state continued to lead the nation in fire-safety spending. Rhode Island was No. 1 nationwide in fire-safety spending as a percent of personal income in both FY 1996 and FY 2006; in both years, its expenditures were more than double the national average, whether measured on a per-capita or personal-income basis.
But in three categories – highways, higher education and parks and recreation – Rhode Island continued to rank in the bottom 10 states for expenditures by either measure. “Furthermore, while the rest of the country has increased highway spending, Rhode Island has seen highway expenditures decline,” both as a percent of the state budget and as a percent of personal income, RIPEC said.
The two largest spending categories were Medicaid/vendor payments and elementary and secondary education, which accounted for 36.5 percent of direct general expenditures by state and local governments nationwide but 44.7 percent in Rhode Island.
“Expenditures for Medicaid/vendor payments remain the primary driver of expenditure growth in Rhode Island,” the policy group observed. They accounted for 11.2 percent of the state budget in FY 1996, when Rhode Island was No. 16 nationwide in spending as a percent of personal income, but 21.0 percent in FY 2006, when the state was second only to low-income Maine. (In 2005, RIPEC noted, the Ocean State was No. 5 for Medicaid/vendor payments.
Cash assistance continues to decline – from $5.60 per $1,000 of personal income in 1996 when Rhode Island was No. 6 for such payments, to $3.21 per $1,000 in FY 2006, when the state is No. 9 – although Rhode Island’s spending remains “above the national average and above its neighboring states,” RIPEC said.
“These expenditure trends reflect policy choices by the state over the past decade,” RIPEC said. “However, the economic conditions facing Rhode Island and the taxpayers of this state require fiscal discipline; resources are strained and these policy directions may not be sustainable.” •