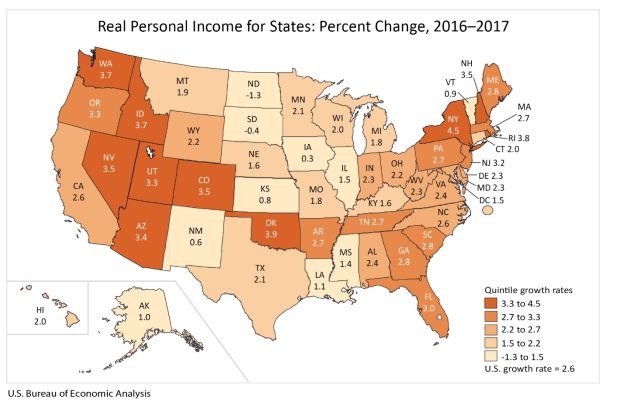
PROVIDENCE – Ten days after a Pew Charitable Trusts study said that Rhode Island was the only state in the union that had no inflation-adjusted growth in personal income in 2018, the U.S. Bureau of Economic Analysis on Thursday released a report on 2017 personal income growth in the nation. And using a more complex formula to adjust for regional factors, including local price inflation and costs, Rhode Island personal income increased 3.8% in 2017, the third-highest rate in the country.
The measurement, called real personal income, accounts for regional price parities and inflation, measuring personal income gains against local consumer price indexes. Rhode Island’s real personal income increase in 2017 was behind New York (4.8%) and Oklahoma (3.9%). Total personal income growth in the United States grew 2.6% over the year.
New England real income increases from 2016 to 2017:
- Rhode Island: 3.8%
- New Hampshire: 3.5%
- Maine: 2.8%
- Massachusetts: 2.7%
- Connecticut: 2%
- Vermont 0.9%
On a per capita basis, Rhode Island’s rank was even higher, tying Oklahoma for the second-highest growth rate in the nation, at 3.8%. Nationally, real personal income per capita increased 1.9% from 2016 to 2017.
New England real income per capita increases from 2016 to 2017:
- Rhode Island: 3.8%
- New Hampshire: 3%
- Maine: 2.4%
- Connecticut: 2.1%
- Massachusetts: 2.1%
- Vermont 0.7%
The report said that Rhode Island’s regional price parity was 98.6% of the United States price level. The Ocean State’s rents were said to be 94.9% of the national price level. Goods in the state were reported to be 98.4% of the national price level. These were offset by other services in the state aside from rent being 101.5% of the national price level.
Hawaii had the highest regional price parity, at 118.5% of U.S. price levels (set as 100).
2017 New England regional price parities as a percentage of national price levels:
- Connecticut: 108%
- Massachusetts: 107.9%
- New Hampshire: 105.8%
- Vermont: 102.5%
- Rhode Island: 98.6%
- Maine: 98.4%
Chris Bergenheim is the PBN web editor. You may reach him at Bergenheim@PBN.com.


